

Home
Development of Vietnam's Mechanical Engineering in the 2026–2045 Period Associated with Enhancing Added Value
Featured News



Development of Vietnam's Mechanical Engineering in the 2026–2045 Period Associated with Enhancing Added Value
26/10/2026
Abstract: In the period 2026–2045, Vietnam's mechanical engineering sector needs to simultaneously expand production and increase added value through capabilities in design, manufacturing, and system integration. By analyzing industry structure, growth scenarios, and sensitivity, the article clarifies capability gaps and requirements for transforming growth quality. On that basis, it proposes organizing support by project and order; linking technology transfer with rights to use and modify designs; developing suppliers according to buyer requirements; allocating resources and evaluating based on actual capacity. The calculation results illustrate the role of increasing the share of added value, serving as a basis for choosing industry development policies.
1. Introduction
The demand for equipment in energy, transportation, and mineral processing opens a large market for Vietnam's mechanical engineering sector. However, participating in manufacturing and installation does not mean mastering overall design, technological equipment, and control. Industry development policy therefore needs to link production expansion with raising technological capacity and the share of value created domestically.
In 2025, the foreign direct investment (FDI) sector accounted for about 61.6% of production value and about 93% of export value of the statistically covered mechanical engineering product group. This structure reflects the major role of FDI in expanding production, while raising questions about the development capacity of domestic enterprises and the degree of linkage between the two sectors. Increased output and exports only translate into a solid industrial foundation when accompanied by the ability to design products, organize supply, and retain value in Vietnam.
The article analyzes the starting point, growth scenarios, and requirements for increasing added value; thereby proposing mechanisms for capacity development, resource allocation, and verification of implementation results. The focus is on converting market demand into the design, manufacturing, integration, and supply capabilities of Vietnam's mechanical engineering industry.

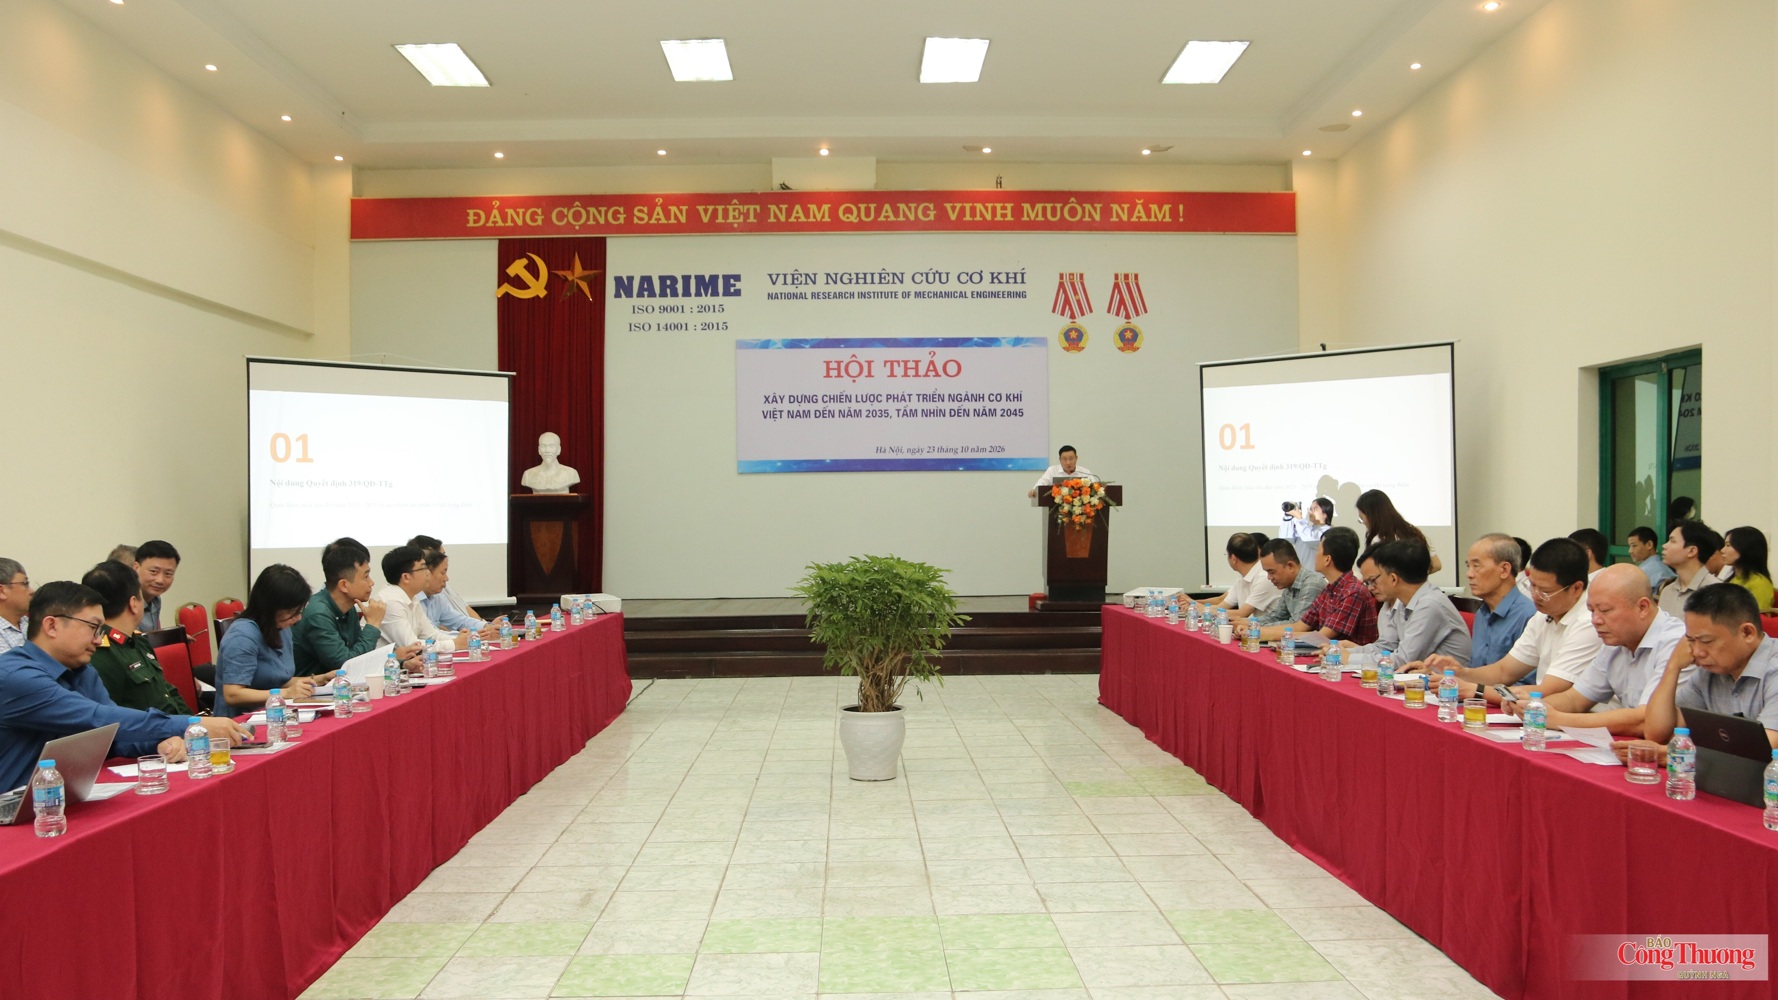
Dr. Phan Đăng Phong - Director of the National Research Institute of Mechanical Engineering (NARIME) speaking at the Workshop on Building the Development Strategy for Vietnam's Mechanical Engineering Industry to 2035, with a vision to 2045.
2. Data and Research Methods
The study uses synthesized data on production, export, ownership structure, and mechanical engineering capacity, combined with targets oriented towards 2035 and 2045. The analysis focuses on the relationship between production scale, value-added share, and technological capacity. Other indicators with different scope or periods are distinguished when compared.
The scenarios take 2025 as the baseline, considering three milestones: 2030, 2035, and 2045. The gap between the current state and the target is used to determine requirements for technology, production organization, and resources; not yet evidence of the ability to achieve the target.
The study consists of three steps: analyzing structure and bottlenecks; calculating scenarios for production value and sensitivity of value-added; proposing support mechanisms based on the relationship between orders, technology, testing, human resources, and suppliers. The paper does not survey new enterprises or estimate post-intervention impacts.
Production value is denoted as GO and calculated as GOₜ = GO₂₀₂₅ × (1 + g)ⁿ; where GO₂₀₂₅ = 3,225.5 trillion VND, g is 6.5%, 10%, and 12% per year respectively, and n is 5, 10, and 20. This is a nominal projection with fixed growth rates. The value-added indicator is denoted as VA and illustrated by VAₜ = GOₜ × αₜ, where αₜ is the assumed VA/GO share at the target year. The sensitivity calculation uses ΔVAₜ = GOₜ × Δαₜ. Results are rounded to one decimal place.
Three indicators need to be distinguished: the localization rate reflects the domestic value share according to the origin determination method; VA/GO is the ratio between value-added and production value within the same statistical scope; the level of design and manufacturing autonomy reflects technical capacity and the right to use and modify technology. VA equals GO minus intermediate costs, and is not synonymous with profit. Purchasing components in Vietnam is not sufficient to prove the origin of domestic value.
The VA/GO levels of about 21%, localization about 32%, and design and manufacturing autonomy about 45% reflect the 2021–2025 period. Since the statistical period differs from the GO of 2025, these ratios are used as reference levels for structural shift analysis, not to establish the official added value of the base year alone. Similarly, when analyzing trade, it is necessary to cross-reference the list of exported goods with the scope of the manufacturing sector to avoid extrapolating results from incompatible sets.
3. Starting point and requirements for growth quality transformation
Table 1: Quantitative evidence on the starting point
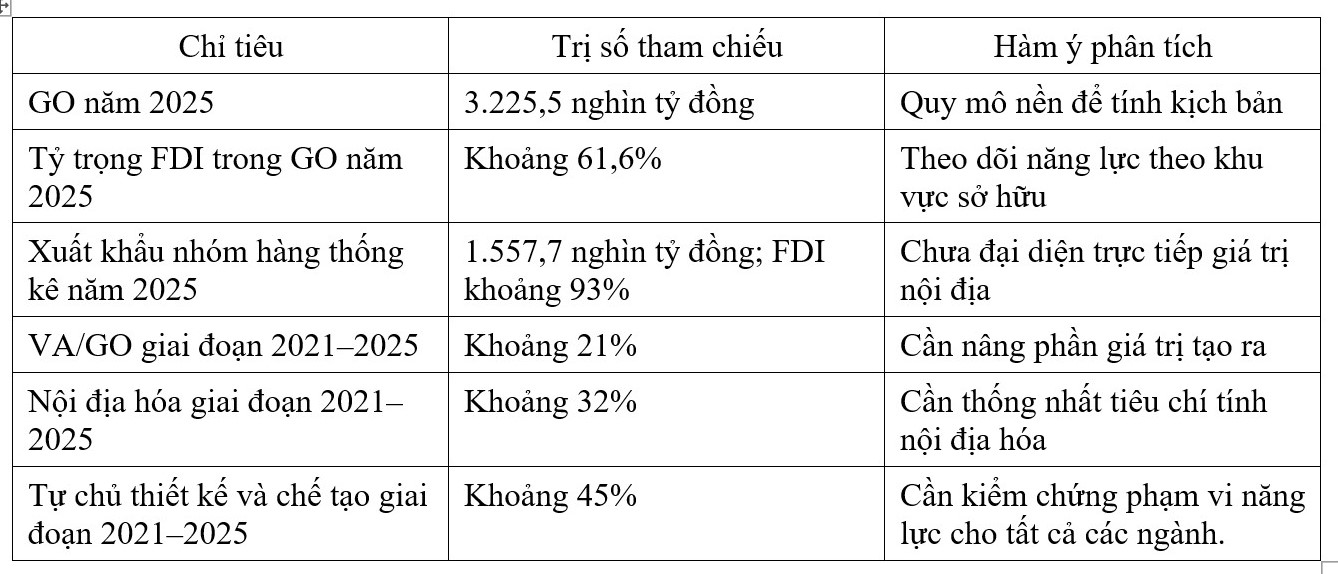
Note: GO and exports are data for 2025, 2025 data according to [2,3].
According to rounded proportions, GO outside the FDI sector is about 1,238.6 thousand billion VND, equivalent to 38.4%; exports outside FDI of the statistical product group are about 109.0 thousand billion VND. This is a structure by ownership, not domestic added value: FDI enterprises can create value in Vietnam, while domestic enterprises still use imported inputs.
The level of demand satisfaction is clearly differentiated: motorcycles and components about 85–90%; agricultural machinery and power machinery 40–60%; complete equipment 20%; metal components for high technology 10%. There is insufficient basis to calculate an industry-wide average from these ratios. Policies need to be suitable for each sub-sector: improving quality and technology in areas that already have scale; developing design, integration, testing, and reference projects in complex systems.
If the measurement method is unified, the targets of 40% localization and 30% VA/GO by 2035 are higher than the reference levels by 8 and 9 percentage points respectively; by 2045, the corresponding gaps are 28 and 24 percentage points. Achieving these levels requires a shift in stages and product structure, going beyond expanding processing capacity.
Lack of orders limits investment; lack of reference projects and testing hinders commercialization. Therefore, support for equipment, research, and training must be tied to buyer requirements, supply capacity, and the potential for subsequent contracts.
4. Scale scenarios and sensitivity of added value
Table 2: Production value under three nominal growth scenarios
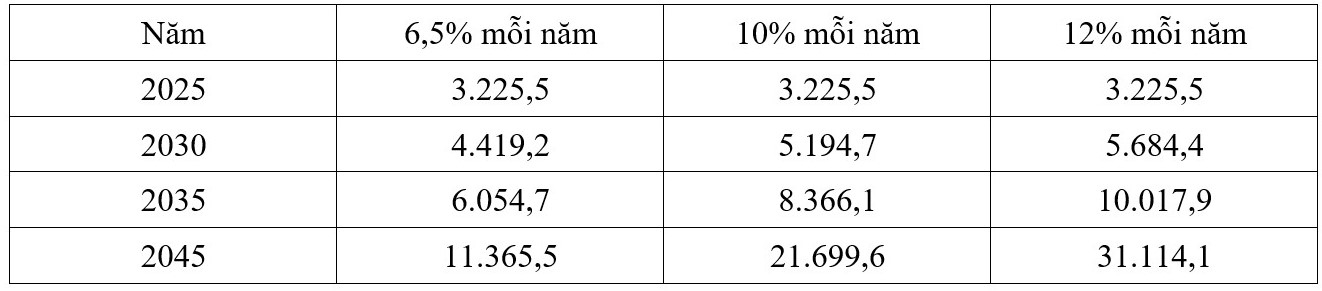
Note: Units are trillion VND at the target year. Results are calculated based on cumulative growth, using 2025 as the base year.
Compared to the 6.5% scenario, the 10% scenario yields a GO higher by approximately 775,5 trillion VND in 2030, 2.311,4 trillion VND in 2035, and 10.334,1 trillion VND in 2045, corresponding to 17.5%, 38.2%, and 90.9%, respectively. The gap reflects sensitivity to growth rates, not the exclusive benefit of the strategy, since the 6.5% scenario is not a no-policy control.
Table 3: Illustrative added value under the scenario of GO increasing by 10% per year
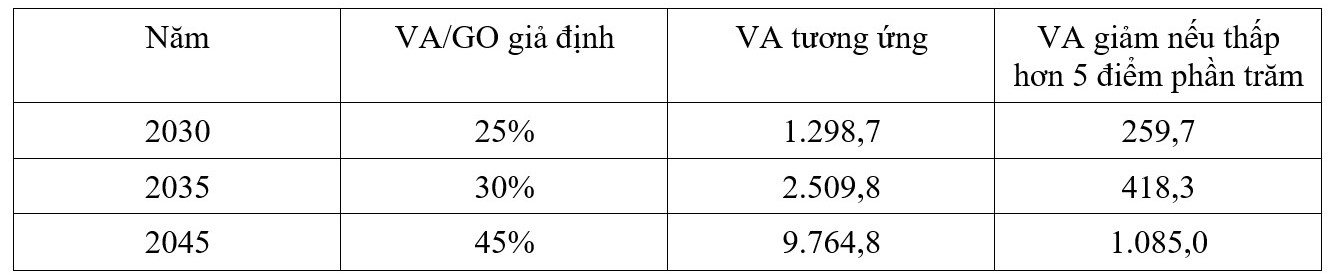
Note: Units are trillion VND at the target year. VA is calculated as GO multiplied by an assumed VA/GO coefficient.
In 2035, with GO of 8.366,1 trillion VND, raising VA/GO from 25% to 30% increases the illustrative VA by 418,3 trillion VND, equivalent to 20%. The result shows the significance of increasing added value at the same production scale. However, to determine the contribution of technology and production organization, it is necessary to isolate the effects of price and product structure using data at comparable prices, by industry and stage.
By 2045, each percentage point of VA/GO in the 10% scenario corresponds to approximately 217.0 trillion VND of nominal VA. This is a projection based on assumptions, not a definitive forecast. Tables 2 and 3 show values for each target year, not cumulative figures. Do not sum GO, VA, exports, and import substitution into total benefits as this may result in double counting.
5. Chain-based support mechanism and technological capacity
Support should focus on tasks with customers and implementation capability. Pilot projects must create reusable capacity for subsequent works: rights to use documentation, calculations and design modifications, manufacturing, testing, integration, and warranty. Acceptance testing must therefore evaluate both the product and the capacity for technology absorption.
Table 4: Intervention orientation and evidence in three priority chains
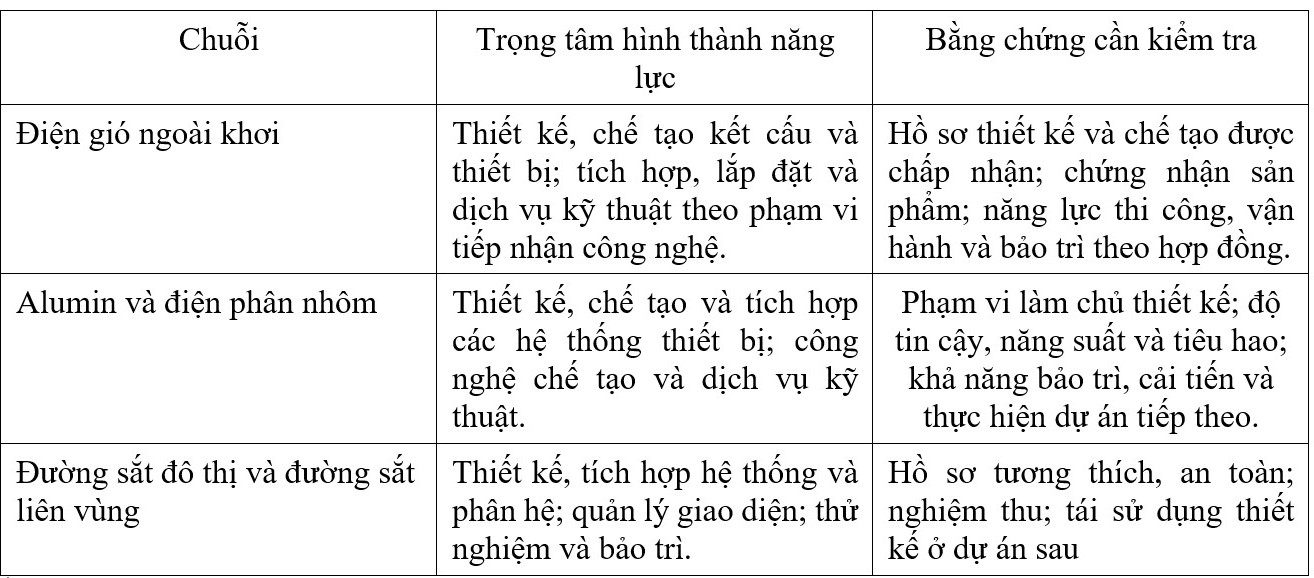
Note: The contents in the table are requirements for establishing and evaluating the capacity of each priority chain.
For railways, integration capacity must be demonstrated through the synchronization and safety of the entire system. For offshore wind power, manufacturing must be linked to design, certification, and project schedule. For alumina and aluminum smelting, the contribution of mechanical engineering must be separated from the overall efficiency of the complex, which also depends on process technology, energy, and operation.
Supplier development must proceed from specific needs, capacity gap assessment, improvement and sample testing to buyer approval, contract signing, and quality monitoring. Management certification does not replace product verification. Lead enterprises must assume responsibility for system engineering, configuration management, and supply network development.
Shared testing infrastructure must stem from actual needs and missing tests; compare new construction with upgrading, linking, or renting services. Operational efficiency is measured by independent customers, utilization rate, turnaround time, and scope of acceptance. Training should evaluate the number of people meeting standards and performing correctly after 6–12 months, rather than merely counting training sessions or purchased equipment.
6. Target roadmap and resource feasibility
Table 5: Target milestones used in research assumptions
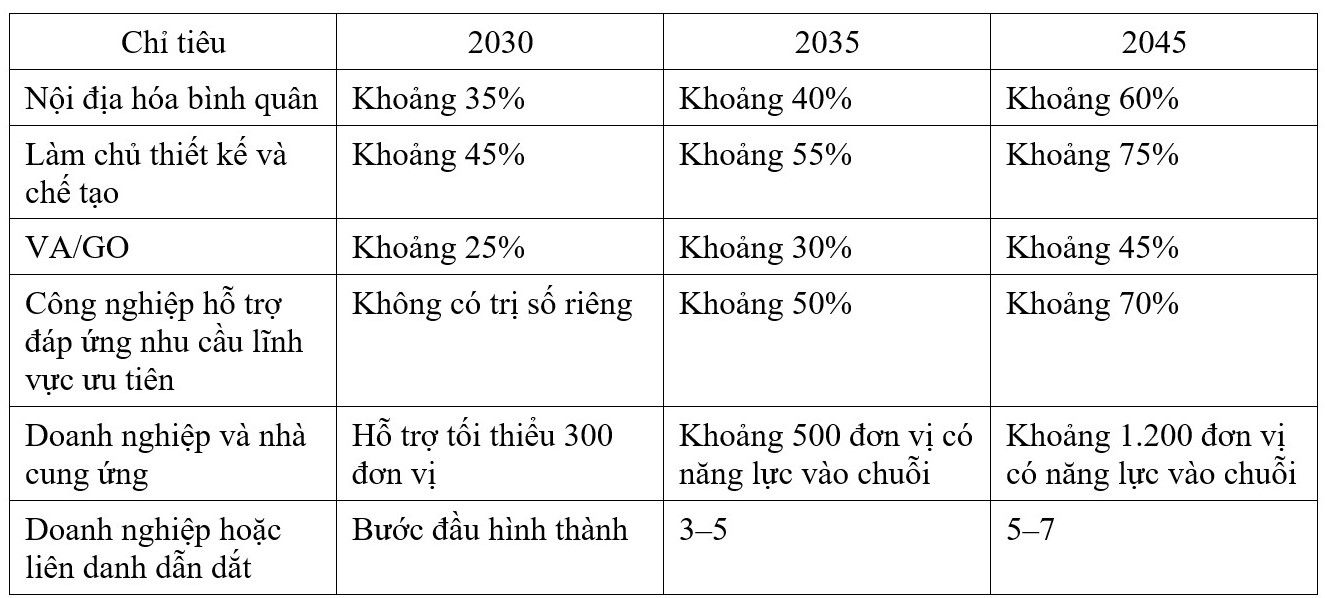
Note: The values are targets used for scenario analysis. The indicator of supported units differs from the number of units capable of participating in the chain.
By 2030, prioritize data standardization and deploy at least 5 pilot projects, clearly identifying recipient enterprises, transferred technology, and mastery criteria. By 2035, focus on repeat orders, system capacity, and multi-tier supply networks. By 2045, evaluate results through product development capability, technological improvement, and competitiveness as support gradually decreases.
By 2035, the workforce needs to reach 20,000–25,000 engineers and experts and 150,000–200,000 technical workers; this is not the number of new jobs created. Priority areas include design, integration, control, manufacturing technology, and testing. At the same time, distinguish the target of supporting at least 300 enterprises by 2030 from approximately 500 units capable of participating in the chain by 2035.
Expected resources are approximately 918.5 trillion VND: enterprises arrange 886.1 trillion VND (96.5%); state budget and international financing, if any, about 32.4 trillion VND (3.5%). Implementation feasibility depends mainly on enterprise investment, requiring orders, cash flow, and long-term capital. These figures are not committed or disbursed capital, nor do they represent the entire domestic mechanical engineering market.
Capital allocation must separate costs for construction, mechanical equipment, technology mastery, shared infrastructure, and operation to avoid double counting or omissions. Support should be phased according to orders and capability milestones, prioritizing assets and skills usable across multiple projects; while also determining mobilization schedules and costs for each outcome.
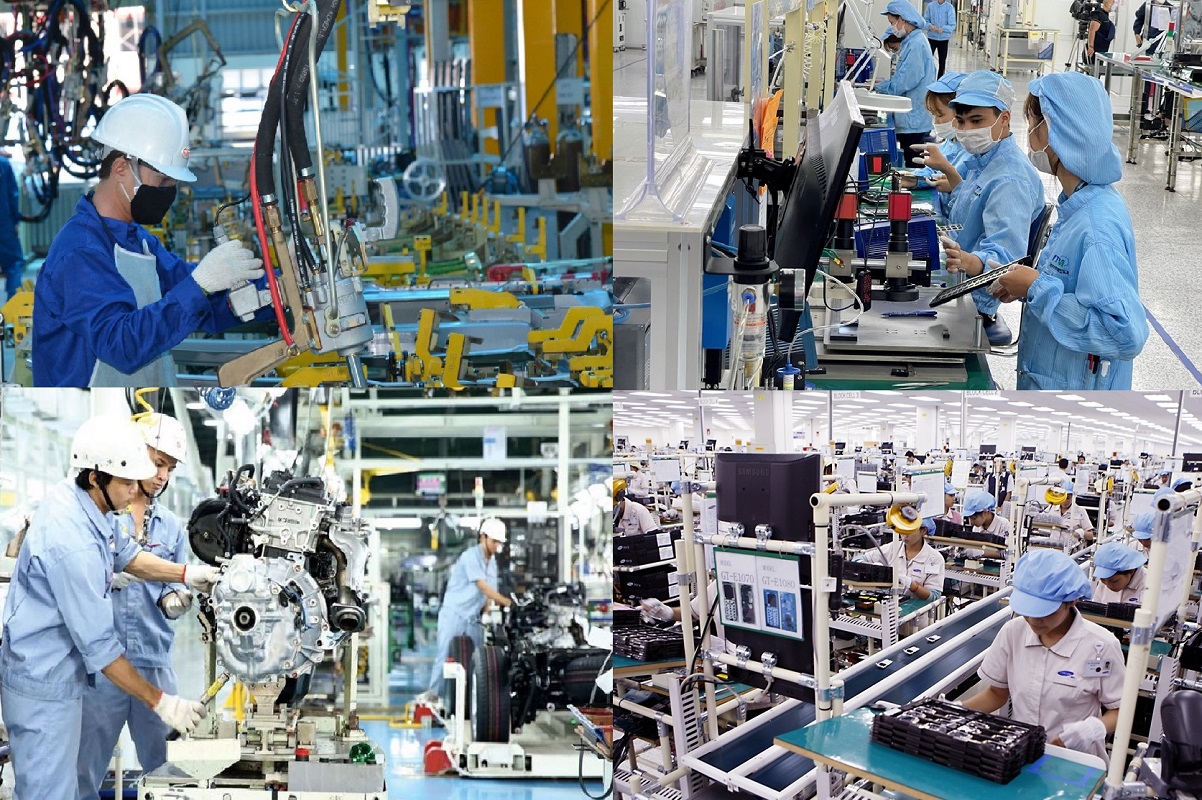
Vietnam's mechanical engineering development for the period 2026–2045 must link increased production scale with enhanced added value and technological self-reliance capability.
7. Impact verification and support adjustment framework
Evaluation must be designed before disbursement. Each enterprise, project, and support package must have a linked identifier, recording initial capacity, support tools, counterpart capital, and committed results. The baseline must standardize industry codes, product catalogs, and statistical units; enterprises participating in multiple chains are counted only once in the total for the entire industry.
Monitor four groups: research, testing, and training outputs; commercial results, quality, and productivity; capability to use, modify, and reuse technology; impact on VA at constant prices, net employment, and lifecycle costs. This approach helps distinguish activity completion from actual capacity enhancement.
When suitable data is available, impact can be estimated using double difference: τ = (Y supported after − Y supported before) − (Y control after − Y control before). Y can be VA per worker, defect rate, or revenue of supported products. The control group must be similar in sub-sector, scale, ownership, and pre-intervention trends; spillover effects and concurrent policies must be examined. The article proposes the method, but has not yet performed estimation.
Hypothetical example: productivity of the supported group increases from 100 to 120, the control group increases from 100 to 112; the double difference is 8 index points. It is not yet possible to attribute the entire 20 points, or automatically attribute the 8 points, to the policy without examining the conditions for impact identification.
Cost evaluation must distinguish between budget, enterprise, and societal perspectives; grants do not automatically create net benefits for society as a whole. When data for calculating net benefits are lacking, costs can be compared per supplier maintaining a contract, per design capability reused, or per person who meets standards and performs the work correctly, with the same cost scope and tracking period.
Expand support when capabilities are verified and follow-on orders exist; adjust when demand is clear but financing, testing, or procedures are obstacles; scale down when capacity is underutilized, costs are high, or market prospects are lacking. Businesses that cease operations must also be tracked. Large programs require independent evaluation and publication of results along with methodological limitations.
8. Development Orientation and Conclusion
Vietnam's mechanical engineering development in the 2026–2045 period must link the increase in production scale with raising value added and technological self-reliance. The production structure remains heavily dependent on FDI, while the level of demand satisfaction differs markedly across sub-sectors. Therefore, output and export growth must go hand in hand with design, manufacturing, and integration capabilities, and the development of domestic suppliers.
Scenario analysis shows that with GO growing at 10% per year in nominal terms, the scale in 2035 would reach about VND 8,366.1 trillion; raising VA/GO from 25% to 30% corresponds to an increase of about VND 418.3 trillion in VA at the same scale. The results illustrate the economic significance of improving growth quality, but do not quantify the net impact of policies or the costs required to achieve the targets.
The priority orientation is to leverage the investment demand of industrial sectors with large market capacity, such as railways, offshore wind power, alumina, and aluminum electrolysis, to build mechanical engineering capabilities that can be developed across multiple projects. Pilot projects need customers, recipient enterprises, and a clear technology transfer roadmap; contracts must specify usage rights, design modification rights, and integration responsibilities. Supplier development must be linked to product approval and actual orders, consistent with the capability gaps of each sub-sector.
Resources should be concentrated on design, integration, testing, technical personnel, and shared infrastructure with actual usage needs. With about 96,5% of expected capital arranged by enterprises, policies need to facilitate the formation of orders and access to long-term capital; public support should prioritize stages with spillover effects and disburse according to capacity milestones. The roadmap to 2030 focuses on demonstrating capacity, to 2035 expands orders and supply networks, and to 2045 enhances product development and competitiveness.
The ultimate measure is reusable technological capability, subsequent contracts, and actual added value, rather than project indicators or disbursed funds. Data standardization and independent evaluation are the basis for adjusting support based on results. In that direction, the large investment market can become a platform for developing a mechanical engineering industry with self-reliance capability and higher contribution to the economy.
References
[1] Prime Minister (2018). Decision No. 319/QĐ-TTg dated 15/3/2018 approving the Strategy for development of Vietnam's mechanical engineering industry to 2025, vision to 2035.
[2] Statistics Department, Ministry of Finance. Data on industrial production value by economic sector and economic component for the period 2018–2025.
[3] Foreign Market Department, Ministry of Industry and Trade (2026). Summary of export-import situation for the period 2021–2025 and comparative data; data provided by customs authorities.
[4] Dong Anh Electrical Equipment Corporation (2024). Ceremony for shipment and plaque installation of the project for design and manufacture of 500 kV–3×300 MVA transformers. https://eemc.com.vn/14346.html
[5] Ministry of Industry and Trade (2023). Mastering many modern technologies of coal-fired thermal power plants. E-Portal of the Ministry of Industry and Trade.
Dr. Phan Đăng Phong – Director of NARIME
Source: Vietnam Mechanical Engineering Journal
Related News


